Source code: FdF
In one of the projects of 42, we are given an introduction to the world of 3D graphics through the FdF project, which stands for ‘fil de fer’ in French, which means wireframe model in English.
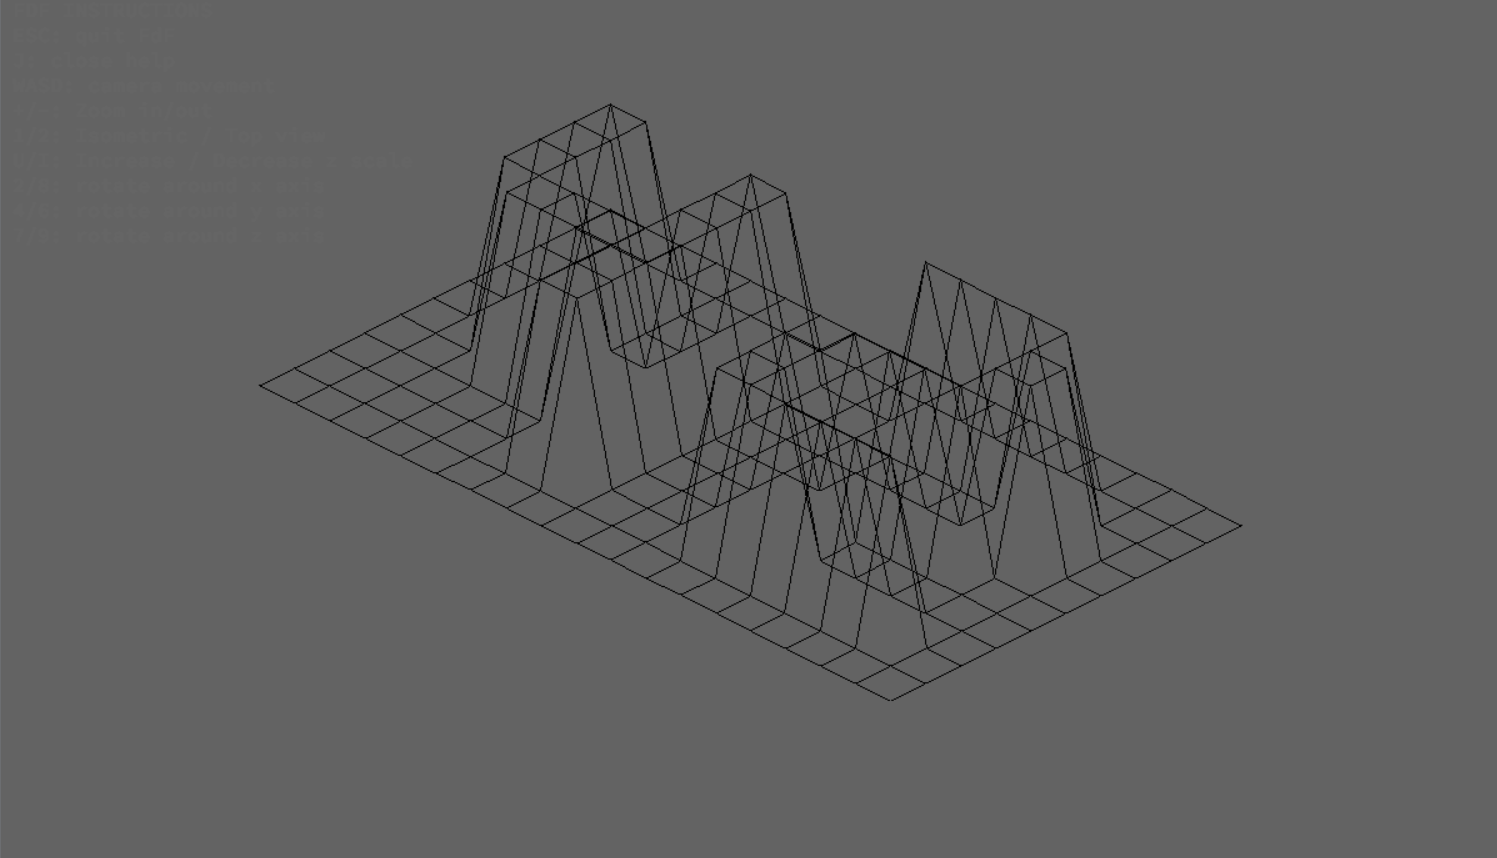
In this project we are asked to use a text file and the school’s graphic library MLX42 to read a map where each coordinate has the value of its height, and represent it graphically in 3D, with a format like this:
$> cat 42.fdf

0 0 0  0  0  0  0  0  0  0  0  0  0  0  0  0  0  0  0
0 0 0  0  0  0  0  0  0  0  0  0  0  0  0  0  0  0  0
0 0 10 10 0  0  10 10 0  0  0  10 10 10 10 10 0  0  0
0 0 10 10 0  0  10 10 0  0  0  0  0  0  0  10 10 0  0
0 0 10 10 0  0  10 10 0  0  0  0  0  0  0  10 10 0  0
0 0 10 10 10 10 10 10 0  0  0  0  10 10 10 10 0  0  0
0 0 0  10 10 10 10 10 0  0  0  10 10 0  0  0  0  0  0
0 0 0  0  0  0  10 10 0  0  0  10 10 0  0  0  0  0  0
0 0 0  0  0  0  10 10 0  0  0  10 10 10 10 10 10 0  0
0 0 0  0  0  0  0  0  0  0  0  0  0  0  0  0  0  0  0
0 0 0  0  0  0  0  0  0  0  0  0  0  0  0  0  0  0  0
As a forewarning, in 42 we have the Norme, several common rules for almost all projects, such as that functions have to be less than 25 lines and each line less than 80 characters. For this reason, I have sometimes had to sacrifice program structure or readability.
What is a wireframe?
A wireframe is an algorithm for rendering 3D objects in which only the edges of the vertices that make up the modeled object are drawn. It requires hardly any computational power compared to other rendering models such as RayTracing, since it does not take light into account or use any method to simulate visibility.
Example:
Solution architecture
Data model
First of all, in order to be able to represent points in 3D, we need a structure containing the X, Y and Z coordinates of each point, as well as its color. To store the color we will use a 32-bit unsigned integer, in order to store 8 bits for each color (r, g, b) and another 8 for transparency.
typedef struct s_point
{
        int      x;
        int      y;
        int      z;
        uint32_t color;
}       t_point;
Now let’s go with the structure for the map. We need to store the rest of the information, the set of 3D points, the height and width of the map, and two other useful values such as the smallest and largest Z value, which will allow us to scale the map so that we can draw the whole map on the screen.
Initially I chose to represent the points as a two-dimensional array, but it is much faster if we do it in a one-dimensional array.1
typedef struct s_map
{
        unsigned int    width;
        unsigned int    height;
        unsigned int    len;
        int             min_z;
        int             max_z;
        t_point         *points;
}       t_map;
The above structures will help us to determine the position of the object in the world, but if we want to see it we have to create a structure for the camera.
Although it is a large structure, it is actually quite simple. We always consider that the object is the center of the world, and we store in offset_x and offset_y how many units we have to move in the X and Y axis so that when we represent the object in 3D it remains in the center.
With this we would already fulfill the basic requirements but I wanted to go further and include several improvements. We will use z_scale so that objects with extreme values of Z can also be seen well in our program, and I have also added the angles of each axis and the zoom of the camera to make the program dynamic and we can go around the world.
typedef struct s_cam
{
        int     projection;
        float   zoom;
        double  z_scale;
        int     offset_x;
        int     offset_y;
        double  x_angle;
        double  y_angle;
        double  z_angle;
}       t_cam;
Implementation of the solution
The operation of the program is as follows:
- Check that a valid map is passed to us.
- Save the values of each point of the file, converting from text to number all the values and saving the hexadecimal values that correspond to the color.
- Initialize the camera.
- Initialize the program window and the image where we are going to paint the points, using the MLX42 library.
- Paint on screen each point in the 3D space.
- Add an event handler that controls which key is being pressed and transforms the image, either by moving, zooming or rotating it.
- Free all the used memory and close the program.
We are going to deepen in points 5 and 6 since they are the most interesting, until now the only thing that we had done is to fill the structures that we have explained previously.
Drawing the map
Now that we have all the data ready, we have to start painting the pixels on the screen.
3D to 2D point projection
First we have the function that is going to tell us the 2D coordinates of a point that we want to represent in 3D. This function receives a copy of the point we want to project and the camera, and applies the rotations, zoom, and makes the trigonometric calculations necessary to represent it in an isometric plane.
I have added several comments to the function to detail its operation.
t_point	project_pt(t_point pt, t_fdf *fdf)
{
	int	x;
	int	y;

	// scale x and y position of the point to the dimensions of the screen
	pt.x = pt.x * fdf->cam->zoom - ((fdf->map->width * fdf->cam->zoom) / 2);
	pt.y = pt.y * fdf->cam->zoom - ((fdf->map->height * fdf->cam->zoom) / 2);
	// we scale the z-axis to the scale we have calculated after traversing the map
	pt.z = pt.z * fdf->cam->zoom / fdf->cam->z_scale;
	// we rotate the point in the 3 axes using the transformation matrices
	rotate_x(&pt, fdf);
	rotate_y(&pt, fdf);
	rotate_z(&pt, fdf);
	// here we have two types of projection, we can see it isometrically and also from a zenithal plane.
	if (fdf->cam->projection == ISOMETRIC)
	{
		x = (pt.x - pt.y) * cos(ISO_ANGLE);
		y = (-pt.z + (pt.x + pt.y)) * sin(ISO_ANGLE);
	}
	else
	{
		x = pt.x;
		y = pt.y;
	}
	// place the point relative to the center of the screen
	pt.x = x + WIDTH / 2 + fdf->cam->offset_x;
	pt.y = y + (HEIGHT + fdf->map->height) / 2 + fdf->cam->offset_y;
	return (pt);
}
Bresenham Algorithm
This function is not as readable as I would like, since I had to decompose it into several functions to pass the Standard.
Once we already have the point represented in 3D space, we apply the Bresenham algorithm, which draws a pixel line between points A and B.

My function is an implementation of this algorithm, also taking into account that the pixel to be painted is in the range of the screen to avoid rendering a part of the map that is not shown. In addition, I have also implemented a function that linearly interpolates the colors of points A and B to create gradients on the edges.
Once we have the pixel coordinates and the color, we paint it on the image with the mlx_put_pixel library function.
void	bresenham(t_point p0, t_point p1, mlx_image_t *img)
{
	t_bresenham	bres;

	init_bresenham(p0, p1, &bres);
	while (1)
	{
		if (p0.x == p1.x && p0.y == p1.y)
			return ;
		if (pixel_limits(&p0))
			mlx_put_pixel(img, p0.x, p0.y, interpolate_color(p0, p1, bres));
		if (2 * bres.error >= bres.dy)
		{
			if (p0.x == p1.x)
				return ;
			bres.error += bres.dy;
			p0.x += bres.sx;
		}
		if (2 * bres.error <= bres.dx)
		{
			if (p0.y == p1.y)
				return ;
			bres.error += bres.dx;
			p0.y += bres.sy;
		}
	}
}
Draw the map on the screen
Now that we have the functions that do all the hard work, the only thing we have to do is to go through the map of points joining each point to its neighbors. If we want to draw point A(x, y), we have to paint the lines joining it to point B(x + 1, y), and to point C(x, y + 1).
Once the Bresenham algorithm finishes drawing the image, we add it to the screen with the MLX function mlx_image_to_window.
void	draw_map(t_fdf *fdf)
{
	unsigned int	i;
	unsigned int	width;
	t_point			pt;
	t_point			*pts;

	clear_background(fdf->img);
	i = -1;
	pts = fdf->map->points;
	width = fdf->map->width;
	while (++i < fdf->map->len)
	{
		pt = project_pt(fdf->map->points[i], fdf);
		if (i % width != fdf->map->width - 1)
			bresenham(pt, project_pt(pts[i + 1], fdf), fdf->img);
		if (i + width < fdf->map->len)
			bresenham(pt, project_pt(pts[i + width], fdf), fdf->img);
	}
	mlx_image_to_window(fdf->mlx, fdf->img, 0, 0);
}
Adding hooks to make it interactive
The library we are given for the project has several functions to handle events.
Through the mlx_key_down function, we can detect which keys the user is pressing and determine the behavior of the program. This would be an example of a hook to control the movement of the camera:
void	movement_hook(void *param)
{
	t_fdf	*fdf;

	fdf = param;
	if (mlx_is_key_down(fdf->mlx, MLX_KEY_W))
		fdf->cam->offset_y -= MOVE_SPEED;
	else if (mlx_is_key_down(fdf->mlx, MLX_KEY_S))
		fdf->cam->offset_y += MOVE_SPEED;
	else if (mlx_is_key_down(fdf->mlx, MLX_KEY_A))
		fdf->cam->offset_x -= MOVE_SPEED;
	else if (mlx_is_key_down(fdf->mlx, MLX_KEY_D))
		fdf->cam->offset_x += MOVE_SPEED;
	else
		return ;
	draw_map(fdf);
}
In this case, the program detects when the WASD keys are being pressed and moves the image up, left, down, and right respectively. Once we have the function created, we have to add it to the main loop with the mlx_loop_hook function. Its use is as follows:
/* mlx_loop_hook(
		MLX instance to add the function to,
		pointer to our function,
		parameter to receive the function
	) */

mlx_loop_hook(fdf->mlx, &movement_hook, fdf);
Final result
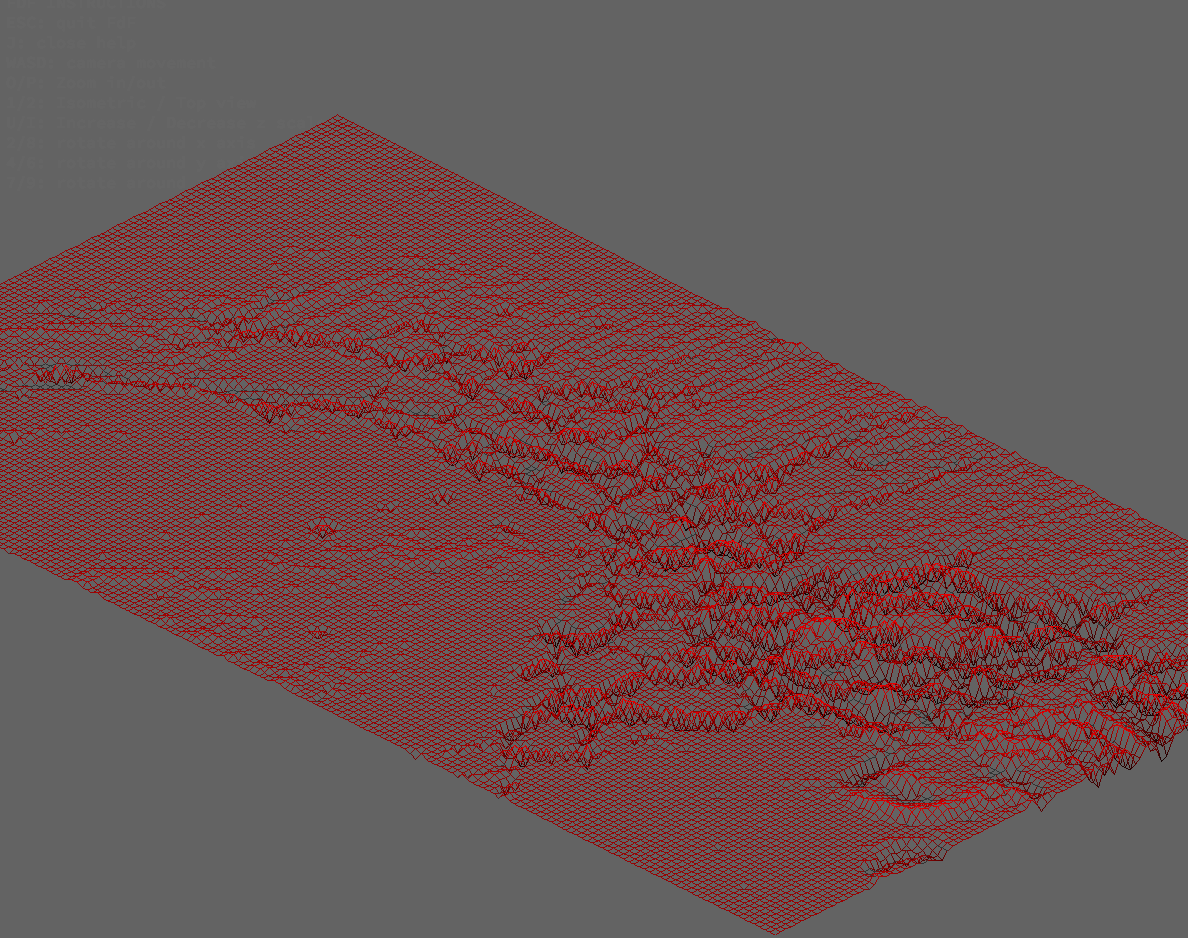
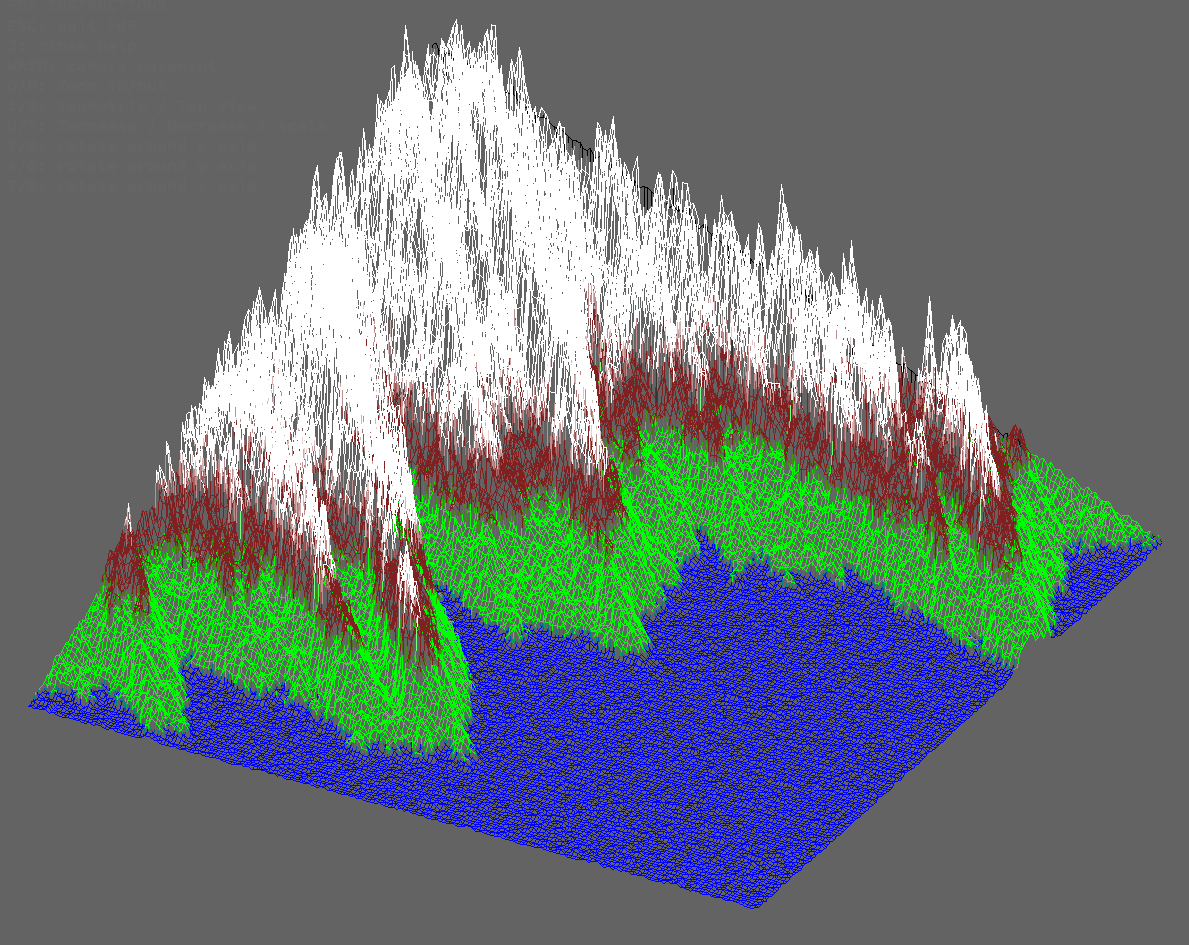
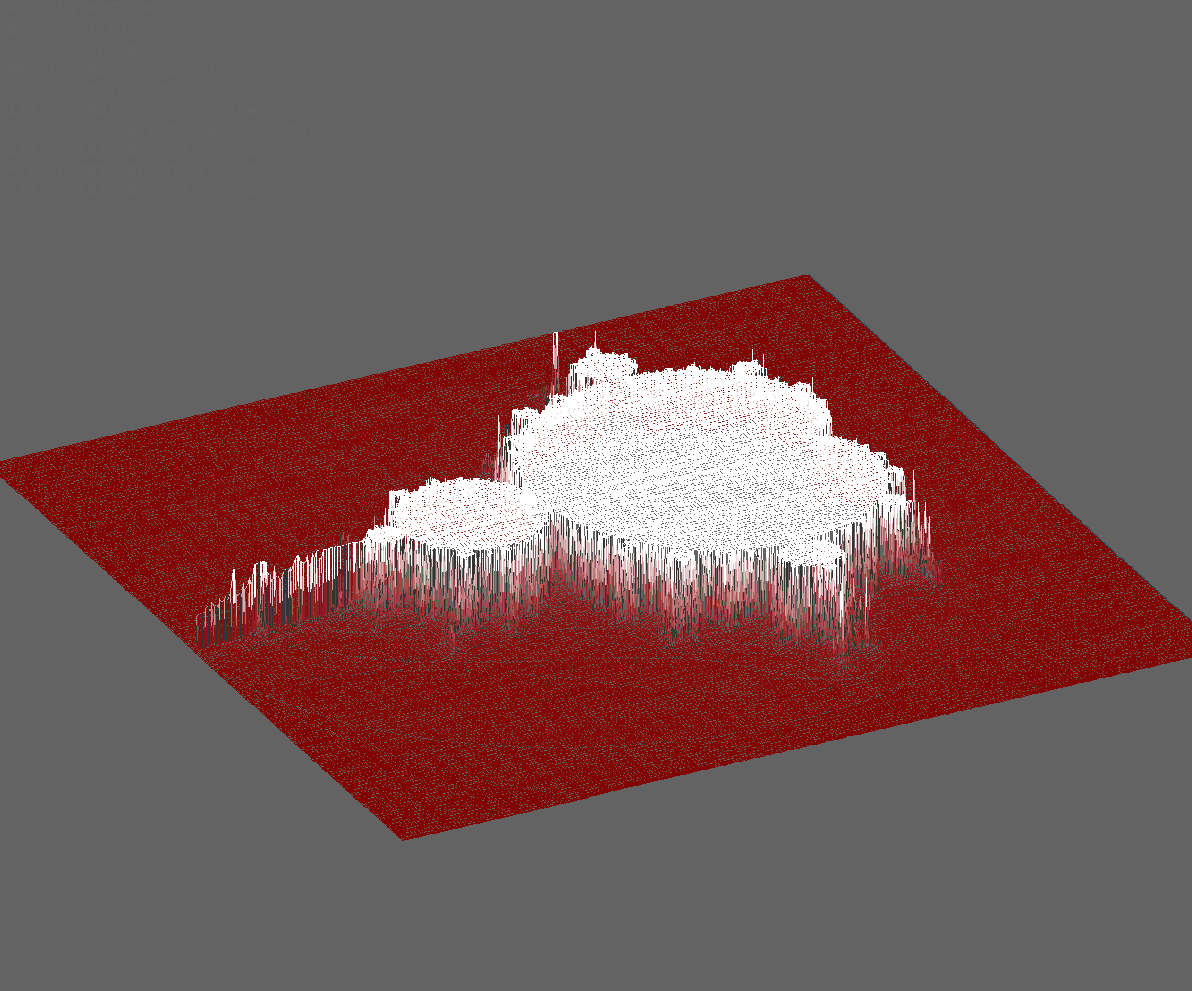
Maps

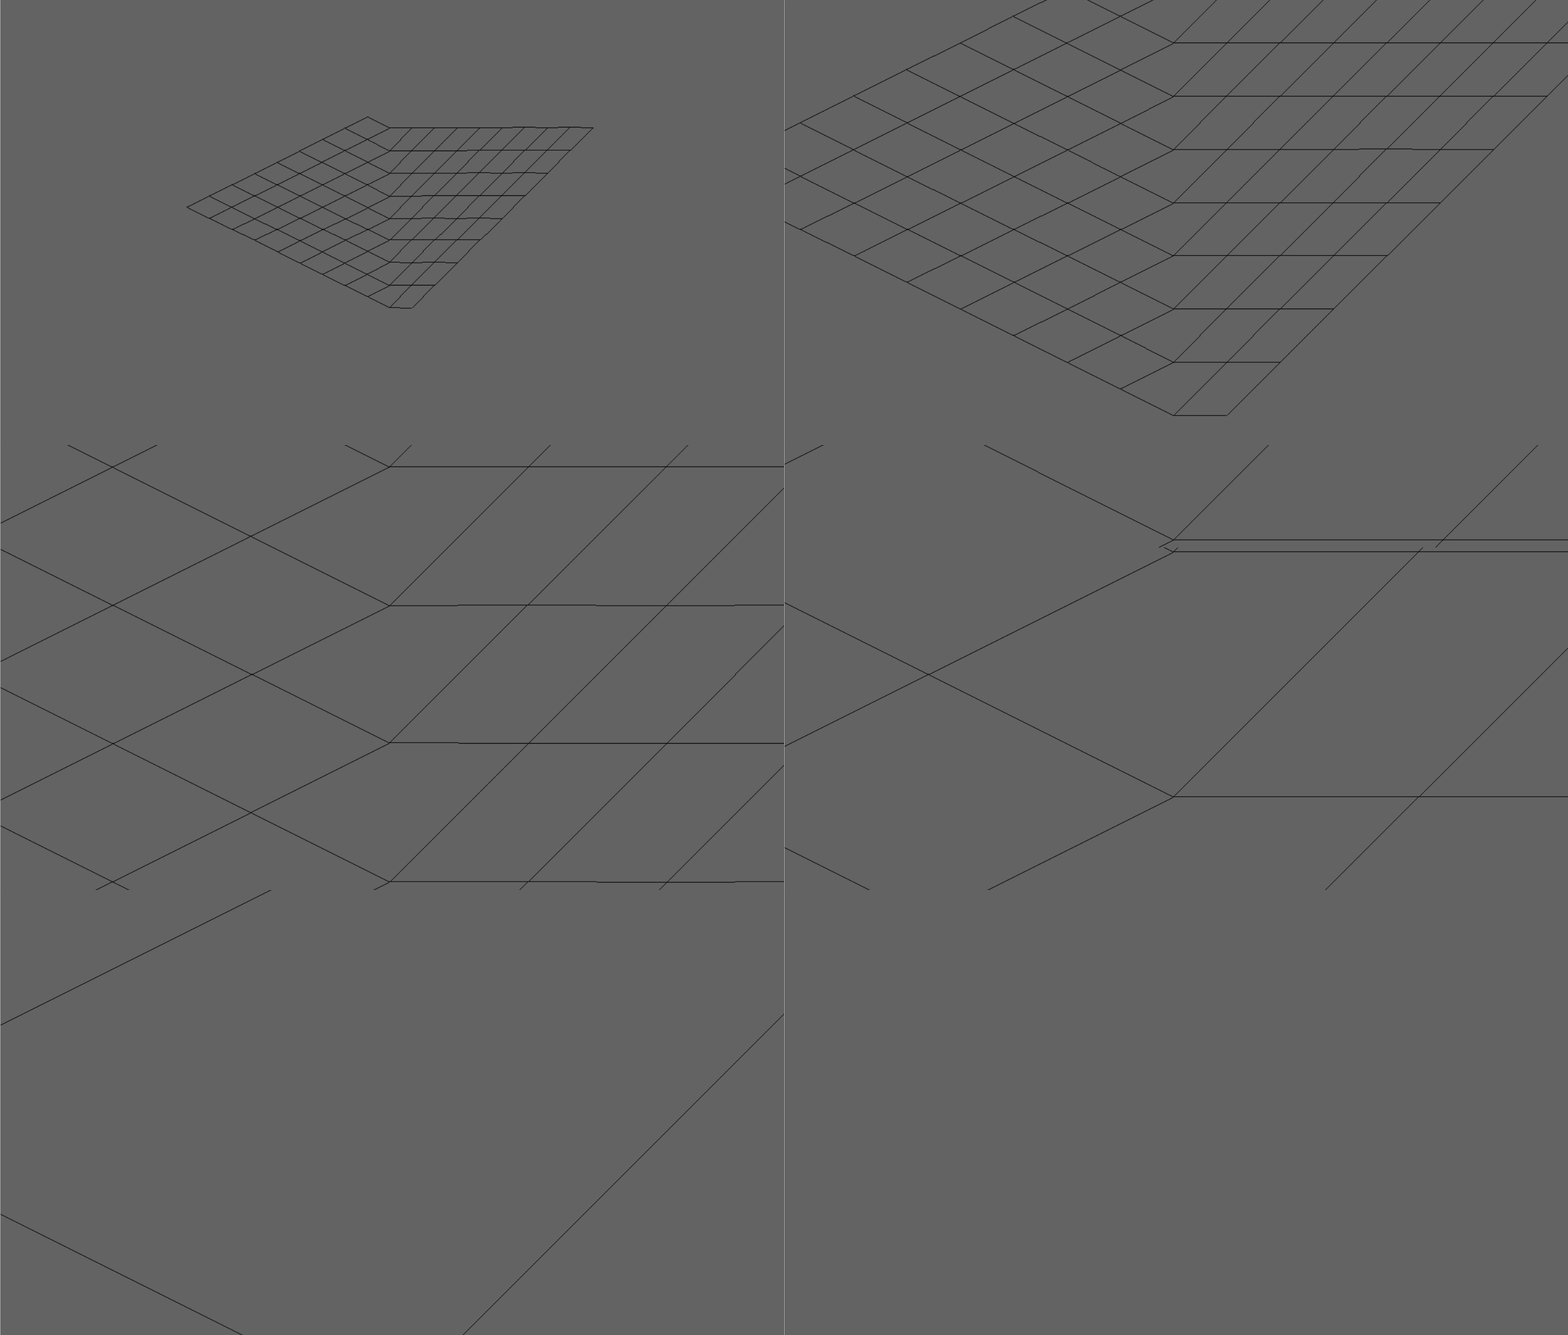
Zoom
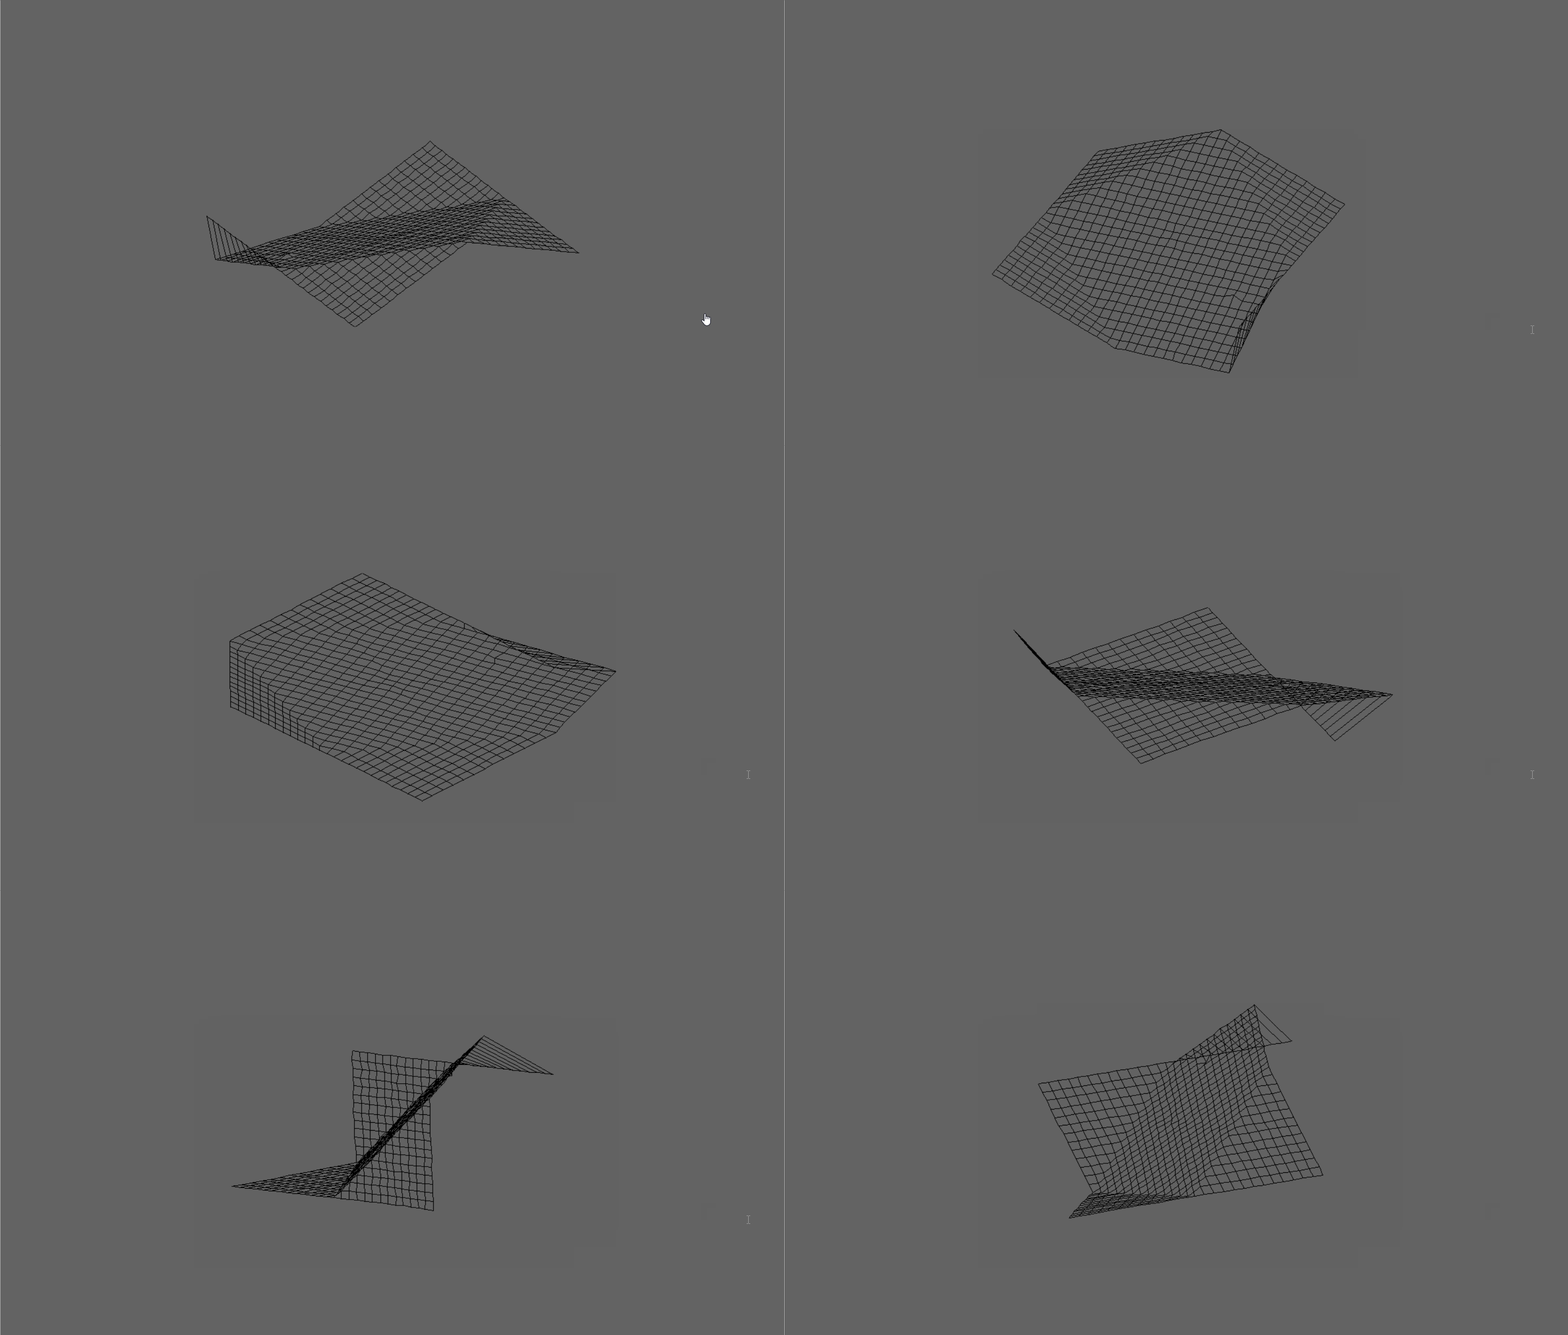
Rotations
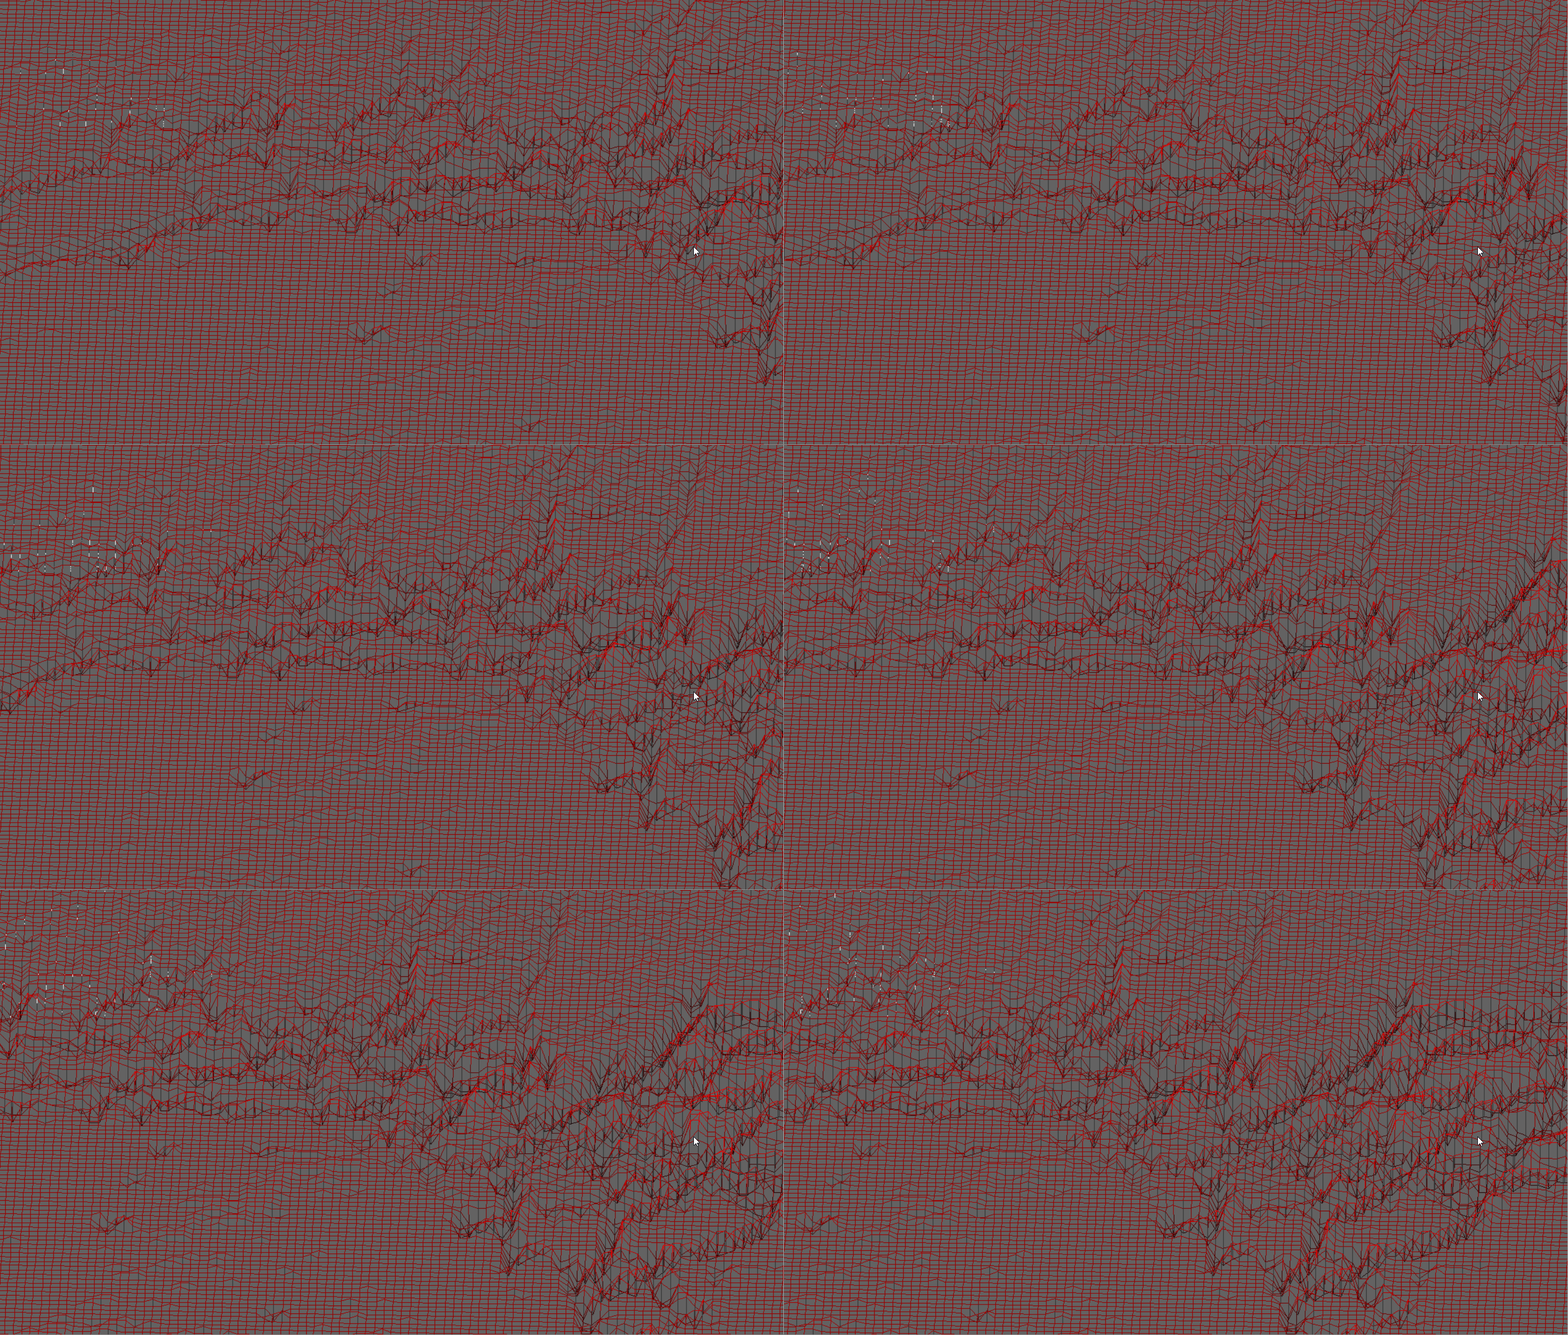
Movement
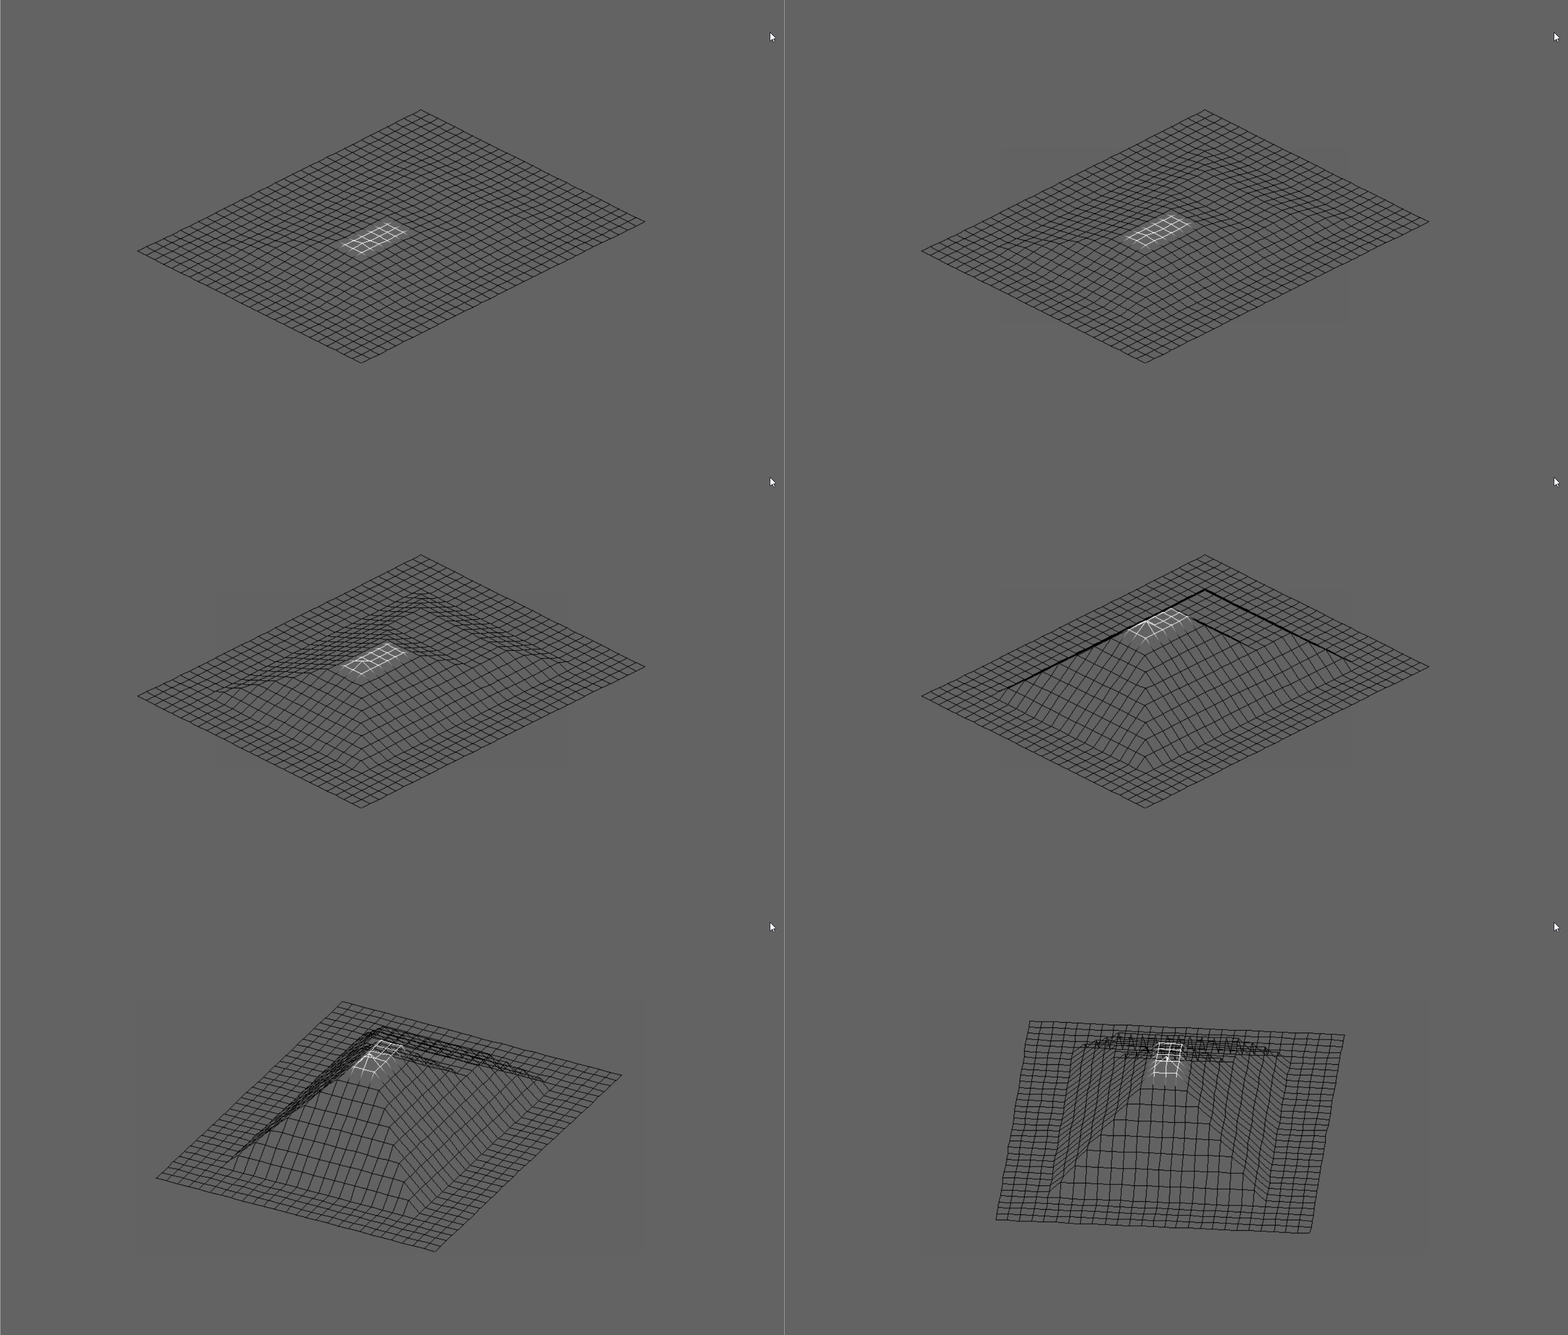
Z scale settings
Other projection types
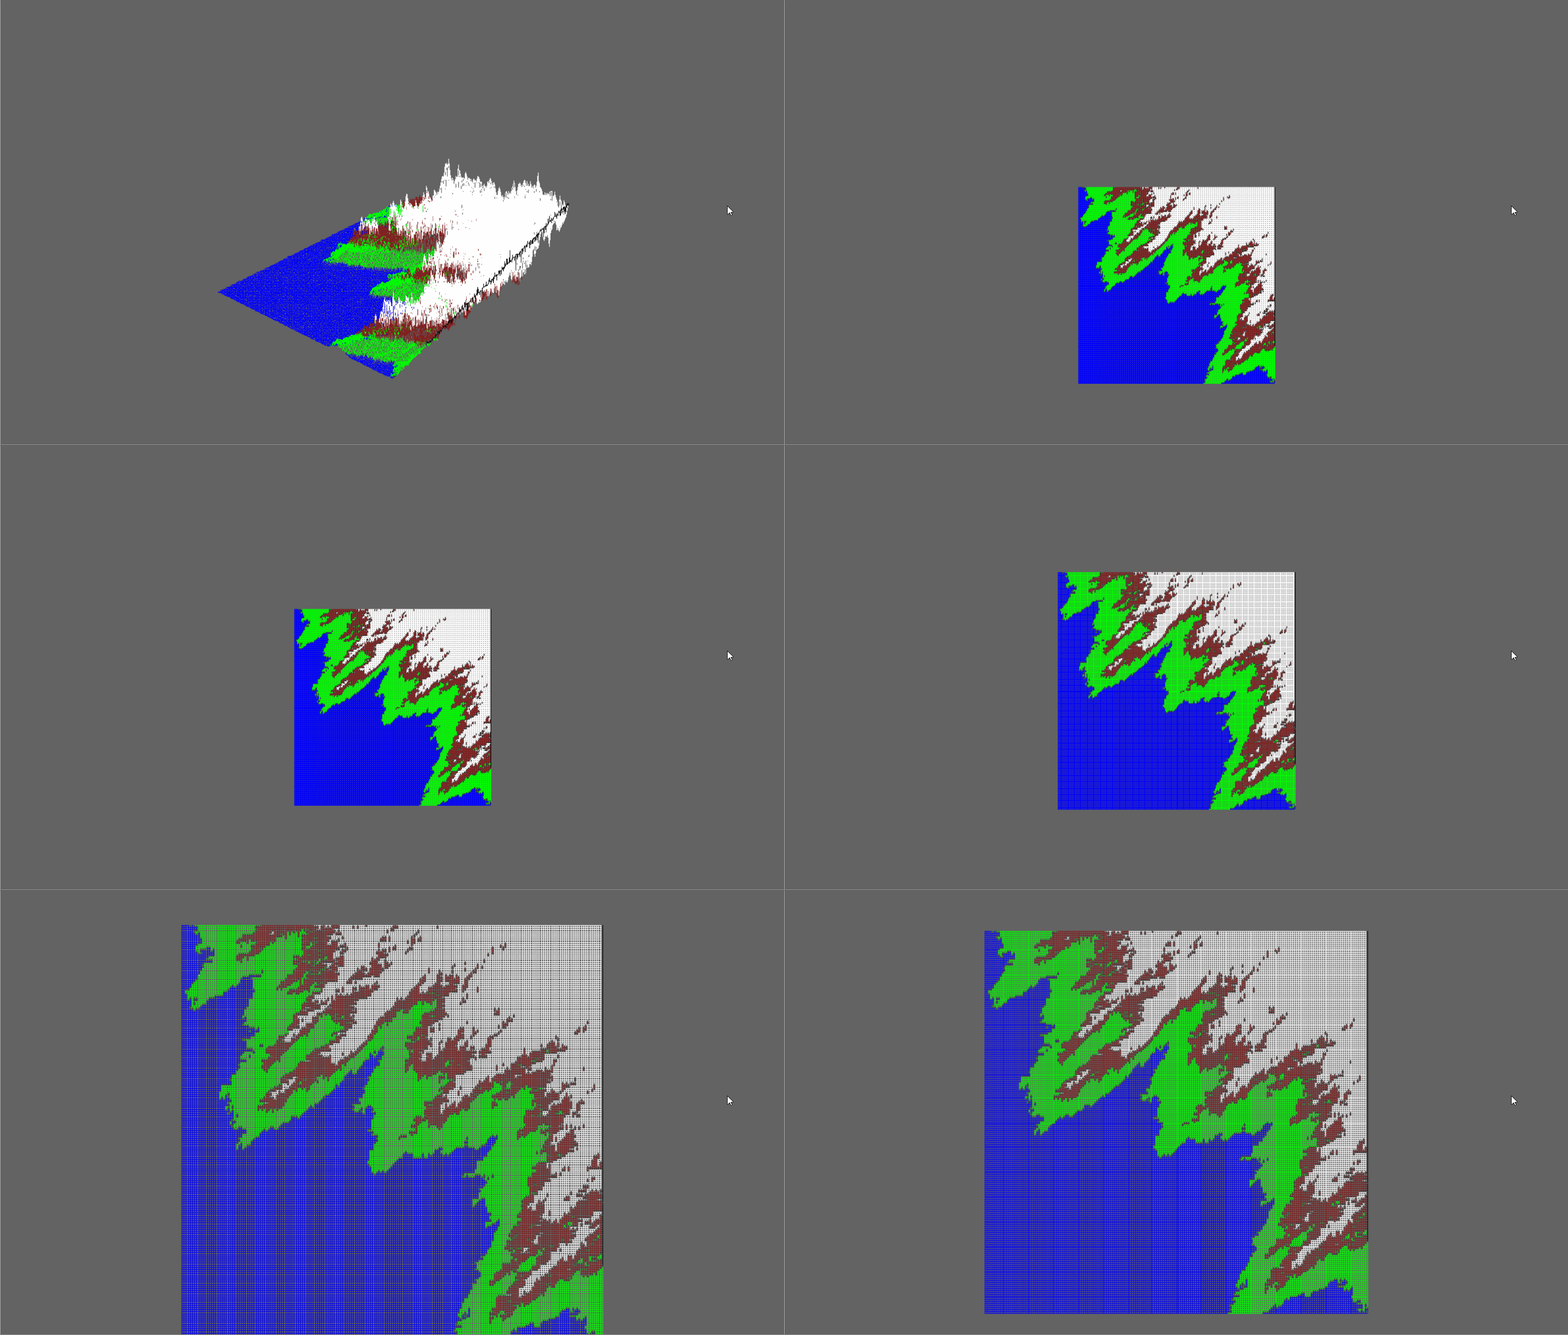
Bonus: rainbow mode!
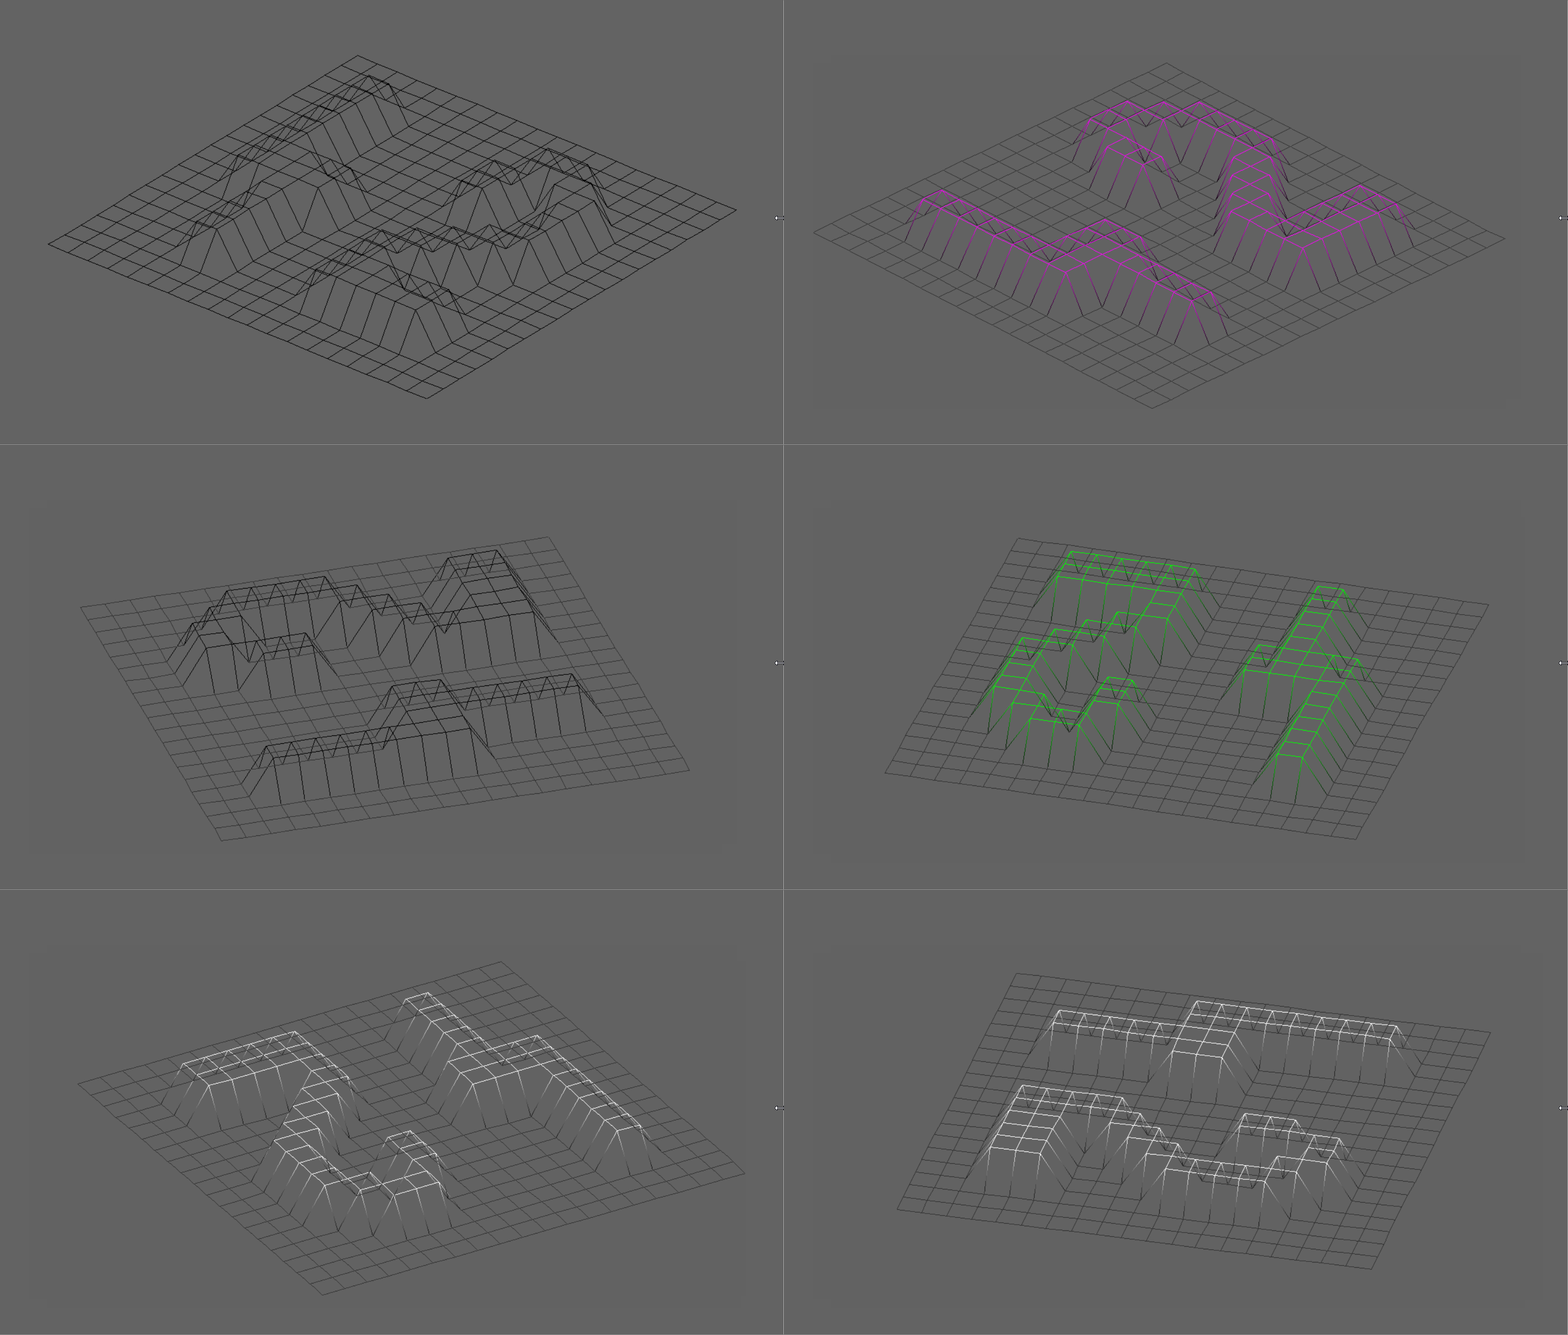
Conclusion
It has been a very satisfying project, graphics programming is one of the most rewarding things there is, you can see the evolution of your program as the days go by, and you go from painting individual dots to complete images.
It is also more complicated to debug, since to render an image of 1000x1000 pixels the bresenham function is called more than 2 million times, and when working with floating point numbers, sometimes problems occur that are beyond our control.
It has been a great experience and I have finally used the trigonometry I learned in the fourth year of Secondary School, I knew this day would come!
